UK Horse Racing's Ratings
How Accurate Are These Ratings?
This is the first question that you should be asking of any ratings service.
From 2008, the first year that Betfair started with their BF Starting Price (BF SP) figures, until the present (December 2011) each of the four years has been profitable for backing the top rated horse in every race within Great Brtain providing that that horse reaches what we call the value price.
When we make the above statement this is after taking the maximum 5% fee from the Betfair SP.
For these four years there has been around four and a half thousand selections a year, about six hundred of these are winners at a strike rate of about 13.5% which isn't too bad.
Where Do the Winners Come From?
Of course not every winner comes from the top-rated horse. If only they would then life would be so much easier.
So we ought to look at the distribution of winners in the ratings to see where most of the winners come from. Now, as a warning the rest of this section has lots of graphs and charts. if this isn't your scene then give this a miss. All this section is doing is to show that the ratings do work and are worth using.
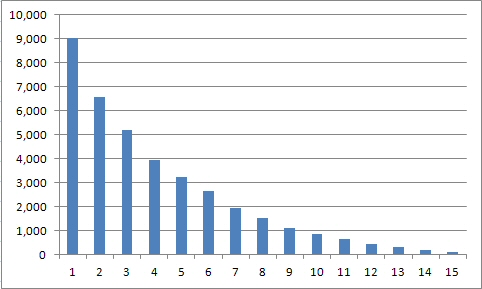
Fig 1. Frequency of Winners within the Top 15 rated horses (2008-2011)
This is the sort of graph which we would like, more to the left and and an ever decreasing number going to the right.
Of course the graph is slightly skewed by the fact that in, say, an eight runner race there are going to be no winners in the ninth, or higher, position. But the graph shows that most of the winning comes from the top few rated horses. There's no such thing as a one horse race and to have the top rated have over 45% more winners than the second rated shows that something is right.
To show that this chart isn't skewed to the top rated horse only because of the differing number of runners, here's a chart showing all the ranking positions for races within Great Britain with eight runners.

Fig 2. Winners in 8 Runner Races in Rating Position (2008-2011)
The above chart should confirm that the ratings work. Quite simply, if they didn't work then that chart wouldn't be in descending order like that.
Whilst we're here, let's look at the ranking positions for each of the five race types so that we can get an overall feel for the ratings.

Fig 3. Frequency of Flat (turf) Winners within the Top 15 Rated Horses
This is a nice descending curve for the GB Flat Races trending down to the right which shows that the flat turf is well rated. There are quite a few good profitable methods by looking in the top two of the ratings in flat races. Looking at this chart we could be excused for wanting to investigate the third rated as well.
Between the third and fourth rated there's a drop in winners of about 25% which would suggest that continually looking below the third rated may not be the best plan but, f of course, one should always look below the third rated to cherry pick interesting looking horses but, arguably, most of the research should be done within the top three rated horses.
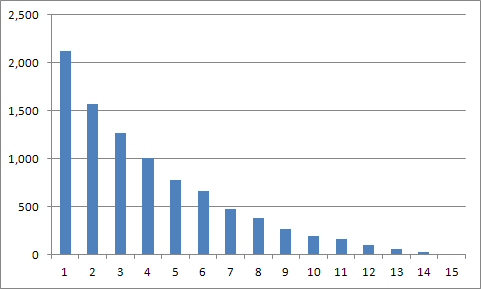
Fig 4. Frequency of All Weather Winners within the Top 15 Rated Horses
This graph for the All Weather shows another good curve but the top rated position certainly does stand out.
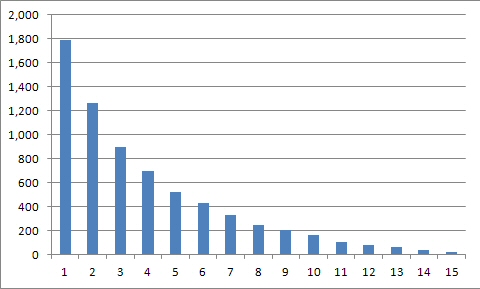
Fig 5. Frequency of Hurdle Winners within the Top 15 Rated Horses
This hurdles graph is most interesting and it offers the question; does one just look mainly at the top rated hurdler or the top two?
The third rated has fewer than half the winners of the top rated but the question, one has to ask oneself, is the second rated worth considering too?
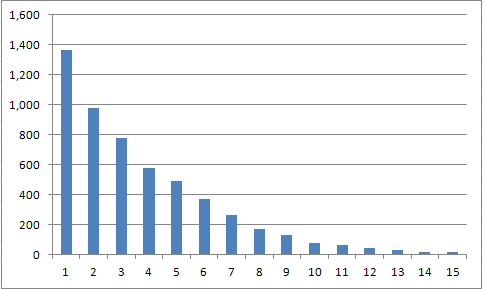
Fig 5. Frequency of Chase Winners within the Top 15 Rated Horses
This graph of chasers is much the same as the hurdle graph but the second rated has had fewer winners. It could be argued that for the chase racing the place to look is the top rated horse.
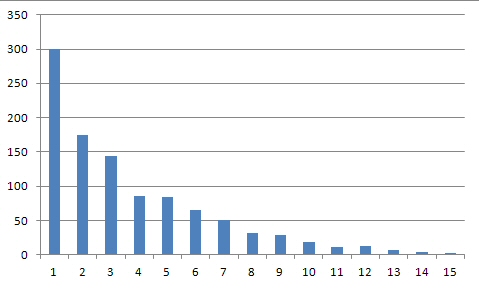
Fig 6. Frequency of National Hunt Flat Winners within the Top 15 Rated Horses
This bumper race graph really does suggest that if one does look into National Hunt Flat Racing then the lion's share of the attention should be given to the top rated.
So, it's the Top Rated only then?
No. Not necessarily.
All we're saying is that the ratings top few rated tend to favour the winners. If one is looking through the ratings manually then do consider every horse but, as the charts above demonstrate, most of the work should be done in the top few rated.