Race Ratings
Introduction
In the detailed ratings, i.e. the individual course ratings, we have had a Race column in the form section (see below) for some time.
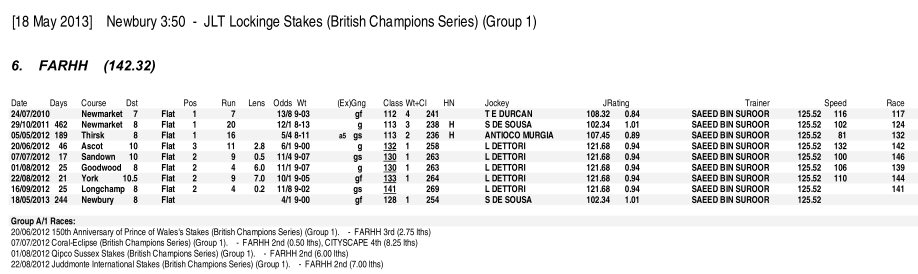
Fig 1. Detail of the Form data (top rated Newbury 3.50 18th May, 2013)
The right hand column, Race, showed how we rated the run in the race after the event so we can get an idea of how a horse has really been running.
In this example we can see that we're running in a class 128 race today but this horse, Farhh, has ran as follows: 142, 148, 139, 144 and then, in its most recent race, 141. Clearly the horse should able to handle today's race class of 128 (which it did; winning at 100/30).
Caveat
These previous race ratings do need to be investigated further to make sure that the maths behind this are working properly so, at the moment, use these for guidance rather than system developments. This, I expect, will change in the future.
Improving?
From the above it was a simple step to determine if a horse is improving or not.
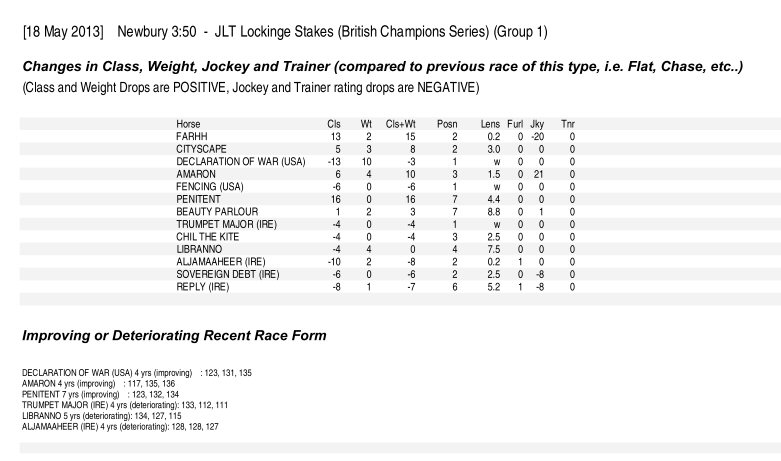
Fig 2. Improving or not? (Newbury 3.50 18th May, 2013)
One definition of an improving horse is one whose last three race ratings figures are getting bigger. Similarly, a deteriorating horse could be classed as one whose last three figures are getting smaller.
Of course, there are many different rules which one could invent to determine how a horse is faring and this is just one of them. Others may have their own opinion and this is where the data within the CSV file could be useful.
The CSV Data
In the CSV files there are five columns: GT to GX. These relate the the five previous race runs of a horse within the same race type.
The left hand of these five, column GT, is the earliest of the five latest runs whilst column GX is the latest run.
Further Additions
The number of columns, each showing a horse's previous run, was reduced to eight from sixteen and more information was added to each column.
Updated: 11th March, 2015