UK Horse Racing's Ratings
Reading UK Horse Racing's Ratings
Introduction
This is not going to be a short explanation and it will involve numerous updates as time goes on because this subject is vast.
If there is something in here which is missing then please do contact us and we will try to expand the page as much as we can.
The first thing that anyone should do is to grab a copy of the ratings file and then, with the aid of the Ratings Description pages get an good overview of what fields are on the ratings and what they fundamentally mean.
Two Sets of Ratings...
...A Summary and Detailed Ratings...
Just so that we all know what we're talking about when we're discussing the ratings; these are the PDF files which we prepare each evening and they come in two flavours; a set of detailed ratings and a single summary rating.
The Detailed Ratings consist of a file for each meeting. So if, for example, there's five meetings in a day then there will be five such Detailed Ratings files.
The Detailed Ratings will consist of an overview page of the ratings, draw bias information (if applicable), a myriad of trainer and jockey statistics and then, finally, a number of pages listing each horse's form and their form progress.
The last part is rather important and it is the major part of what I use when go racing and I wish to 'solve' the race.
The Summary Ratings is a collection of each of the overview pages from each of the races and they are placed together in one file.
As mentioned higher up on the page, the Ratings Description pages are a good place to start to get to know what each of the columns in the overview section mean.
It is advised for those who wish to read the ratings to use the detailed versions and then, afterwards, use the summary as an overview.
...and a CSV file too!
The CSV file contains all of the data which can be found in the Summary Ratings as well a good amount of data from the Detailed Ratings.
The CSV file is particularly useful for those who wish to use it for their automation systems or selection processes. We know a good number of people use the CSV files to help their selection processes.
So in terms of reading the ratings there's nothing extra in the CSV files but if one wishes to use the CSV file then more information on the contents on the file can be found in the CSV File Legend.
The Jigsaw
Some people refer to 'solving' a race akin to doing a jigsaw puzzle.
Like a jigsaw puzzle there's plenty of pieces to look at and consider in order to get the full picture. Of course, with the jigsaw puzzle one knows that there's so many thousand pieces to put together, but when trying to solve a race there will always be more peices than there are available to the punter but that need not stop the punter trying to create a good picture from the clues and information on offer.
In other words, one has to look at the ratings and come up with lots bits of information, thoughts and then one has to weigh them all up before deciding if there's enough information to have a worthwhile bet or not.
Sometimes, and this is rare, one peice of information stands out and appears to be so strong that one thinks "yes, that's it!" But, for the most part it's a collection of thoughts all collated together to try to get a view of what is likely in a race.
First Comments
The first comments by one member who reads the ratings have arrived and they give a good idea of where to start.
"Well, from the Summary I look for heavily underscored horses, or well rated top rated horses (about 10 pounds clear). I also look for strong stalls bias indicators for Flat/AW races.
"In the Detailed Ratings I watch out for the recent stalls bias which is very good indeed, because it pinpoints more recent stalls trends over the longterm trends. I also look out for the 'improvers' and also use these for the analysis."
Firstly we may need to clarify as to what an underscored horse is, so for those not familiar with this terminology please refer to this FAQ on Underscored Horses. Note that Ranked values are now marked in the Ratings by being emboldened.
It would be a good idea to explore some of these points in the following sections.
Heavily Underscored Horses
In the Ratings one can see that some horses are well rated, not only in terms of final position in the ratings, but that they have a number of fields which have the hghest rating, or score, in the race. As described in the Underscored Horses FAQ item these will have these fields underscored.
If a horse has a good number of fields underscored then it's worth having a close look at it.
Highly Rated Non-Underscored Horses
Sometimes a horse, high up in the ratings, doesn't have any underscores at all.
So how did it get there? Well, it may be a strong second best in lots of fields and because it's solidly rated these sort of horses tend to be worth having a second look.
Stall Bias
It's no secret that some flat and all-weather courses have a strong stalls bias. This means that a horse setting off on, say, the five furlong at Beverley on the inside rail will have an advantage over the horse on the outside.
Mostly the stall biases are on the shorter distances but sometimes, for example at Goodwood, there is a strong stalls bias for the mile and even up to a mile and a half distances. Some courses, such as the five furlong straight at Sandown favour the right hand side stalls.
At some courses, such as Chester, it is believed that the stalls bias is so marked that a running joke is that fastened to the outside stall is a stack of self-certificates for the trainer to declare his horse to be a non-runner as it is perceived that being on the outside at Chester is a huge disadvantage.
Note: In 2011 the British Horseracing Authority (BHA) in their somewhat less than spectacular "Racing For Change" policy changed the stalls numbering so that it's supposedly easier to understand. It's just confused me and about everyone else but be assured that the data within the UK Horse Racing database has been modified to handle the changes. This means that the UK Horse Racing Model now has even more of an idea as to what is going on than I do.
In the Detailed Ratings for a race with a historical bias of any sort, i.e. the flat and all-weather, we produce a chart like the one following.
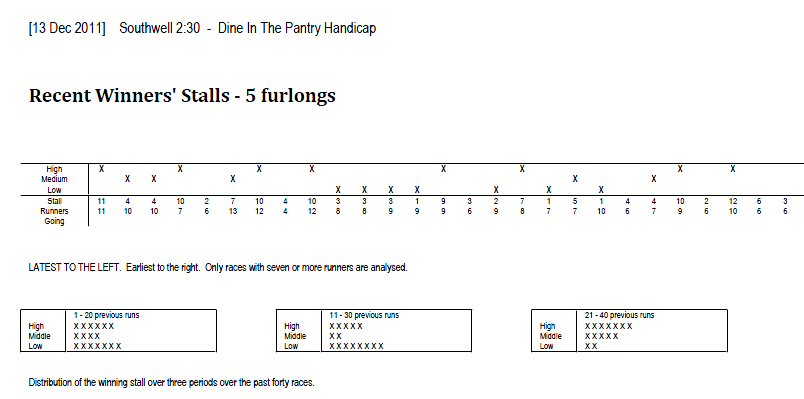
Fig 7. Southwell's 5 furlong stall bias (December 2011)
The above illustration from the Detailed Ratings (13th December, 2011) show the last forty runs over five furlong at Southwell (the last twenty or so are shown only so that it fits nicely onto this page). The larger grid shows in which area of the stalls, high, middle or low, from where the winner came from.
The three smaller tables at the bottom show the distribution of the winning stall area in
- The last twenty races
- Races eleven to thirty ago
- Races twenty-one to forty
In other words we can see if a small trend is appearing.
Now, Southwell's five furlong all-weather has a reputation for having a strong bias for the lower stalls. What has happened in the past is that there was a recent move to the high stalls and now things are moving back to normal, i.e. the lower stalls are coming back from what may have been a long term blip. And this can be seen in the right hand box where it is clear that most of the winners came from the higher stall numbers and only two from the lower third.
But, look what's been happening of late. The middle third haven't won anywhere as near as they had in the past and the area which has taken their winners has been the lower third.
So, this informationn in the Detailed Rating now gives us a warning that the current stalls bias isn't running quite as it was before though things are getting better.
This is being written in the morning before the race so we don't know the result yet but looking at the ratings for this race but of the top three rated horses in this race none of them have a positive long term stalls bias. But looking at the recent stalls trend this need not be a bad thing and perhaps it may be a good idea to consider going against the long term stalls trend.
This example of the short term trend opposing the long term trend is a good illustration as to why the Detailed Ratings should be examined when processing the ratings manually.
As a further example, at Southwell today (still the 13th of December) there's a seven furlong race. The stalls bias has changed from the long term trend of being fairly even across the board to a recent short term trend of favouring the centrally drawn horses. Again, more information for the jigsaw puzzle.
As it happened the results for the five furlong race came from plump in the middle of the stalls and for the 7 furlong the winner came from a positive stall bias stall, on the higher side.
White Space
One of the things which I particularly look for when manually processing a race is to look at the overview page of the race to check that there's what I would consider to be enough data presented.
If I perceive that there's a lot of white space to the right hand side between the Conn column and the prices I then think that there's not enough real form to go on and I would tend to ignore the race.
The amount of 'white space' is a personal thing but if it looks bare then I tend not to get involved unless I am going to go to the meeting and am having a fun bet (when I go racing it's a Busman's Holiday) or when someone asks me to look at a race.

Fig 8. Lots of white space to the right hand aide of the ratings
The above ilustration (taken from the ratings for the Bangor 1.45 on the 14th of December, 2011) shows what I call exessive white space to the right hand side of the ratings. Apart from the Frm column, which are all zeroes other than a somewhat large negative rating, there are few columns with data in there.
This is what I call White Space and instantly I am taking a dislike to this race.
One will note, however, that there is lots of stuff on trainer and connections form and if I were to be looking at this race then I would be looking at the trainer and jockey statistics to see if anything worthwhile can be gleaned from those figures. If I can't get anything from there then the race would be a certain and definite no-bet even if I were on course.
Looking at this race in the ratings, even though it's not visible here, about two thirds of the horses have ran the once, one horse (the one with the negative Frm value) had run twice before and the remainder have never raced before. So, with little information to "hang one's hat on" this is sort of race which I prefer to leave well alone.
As it happens the second rated won exceedingly well but I wouldn't have been involved with this race at all. I tend not to touch a race unless there's a fair amount of data to look at. Here, I feel is too little. This is, I have to stress, my own personal view; yours may well differ as you may find that you would like to hunt and find a good priced winner. The two horses, which were placed and thus return on the each-way betting came in at 33/1 and 20/1. So those looking for a good priced placed horse may find this sort of race appealing.
Trainer & Jockey Statistics
In the Detailed Ratings there are quite a few sections containing the statistics of the trainers and jockeys.
In this description it's perhaps best to have a copy of the ratings open so that one can follow the discussion through the ratings.
Finally, be aware that the data within the Trainer & Jockey Statistics has nothing to do with the Ratings at all. This is pure statistical information on trainers and jockeys but has been included because they can be important and also because we feel that we ought to give them to you.
Trainer Recent Form
This is simply a record of how each trainer has performed recently, as the name suggests. We're looking at how a trainer has performed over the last twenty runs, the last two weeks and the last four weeks.
In some high profile trainers twenty runs make ony take a few days whilst some trainers could take years to get twenty runners out.
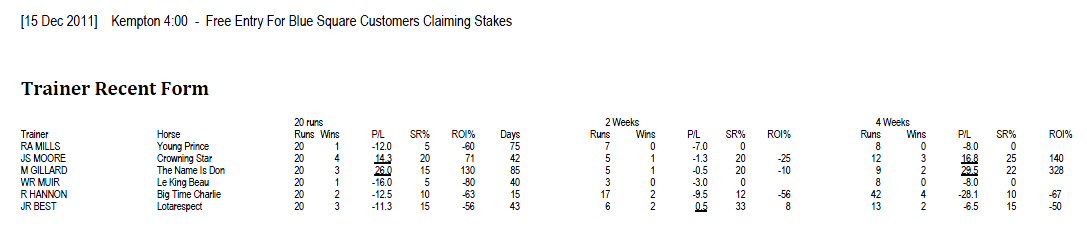
Fig 9. Trainer Recent Form
In the above screenshot, taken from the Kempton 5.00 for the 15th of December, 2011 (as will all excepts for this section) we can see that six horses and their trainers are listed. First of all, do note that all listings in this section are in Ratings order so Young Prince will be the top rated horse in this race and Lottarespect is the bottom rated.
The first section to the right shows how the trainer has fared of their previous 20 runs (the data search only goes back five years for the statistics in this section, so be aware that nothing is examined for over five years prior to the racing on this date). The first column lets us know if the trainer has had twenty runs in the last five years; yes, they all have here because the number 20 appears. If a trainer has only had, say, 15 runners in the last five years then we'd know here.
The next column tells us how many winners has been had in the last twenty runs, the profit/loss if one backed the horse to SP and then the next two tells us the strike rate and the Return of Investment (ROI) for those twenty runs. The last column in this little block tells us how many days it took each of these trainers to get twenty runners out.
So, in the above example RA Mills took 75 days to saddle twenty runners or which one won and a £1 bet on each of these made an over all profit/loss of -12, or a loss of £12. This means that his strike rate is 5% and his ROI is a less than impressive negative 60%.
If a Profit/Loss figure is underlined, as is the case of JS Moore then it's to simply to draw our attention to the fact that in the last twenty runs a profit was made. So, in this case backing all of J Moore's last twenty runners would have meant that a proft of £14.30, to one pound stakes, would have been obtained.
The next block of data is very similar but it tells us what has happened in the previous 14 days.
In the above example every trainer had horses out in this period and two failed to score at all. Two trainers had two winners and only one trainer, JR Best came out with a profit if you backed all his horses in this time. Not a huge profit but he would have had only six runner of which two won and that £6 staked would have been turned into a sum totalling £6.50. All other trainers in this race made a loss over that period.
There is a similar section of these five columns (Runs, Wins, P/L, SR% and ROI%) for the four week period to the right of this section and these work in a similar manner but looking at four weeks rather than two.
So, reading these charts to try to add to the jigsaw. Well, to be honest with this example there's not a lot which can be added. The only obvious thing to state is that sometimes between two and four weeks ago two trainers had a good priced winner. But, that in itself isn't interesting for analysis.
What would have been interesting would have been if one of the trainers had a pile of winners in the right hand block and none in the 2 week block. Then one could argue that is that something has gone horribly wrong with the trainer. But in this example we see what's normal; trainers running some horses and most trainers not being profitable.
These five columns are common within the reports and printouts of UK Horse Racing so getting used to read them is essential but they are rather straightforward.
Trainer Calendar
The Trainer Calendar is, we're proud to announce, one of our own inventions though we have started to see a few other sites take up the concept.
In the above section we've seen how a trainer's statistics has been given for the last number of days and for the last number of races. But what about looking at how a trainer fares at this time of the year?
So, we've come up with the Trainer Calendar.
What this does, quite simply, is to look at how the trainer in question performs at this time of the year. This is because some trainers are reputed to be strong at certain times of the year. For example, Sir Mark Prescott rarely, it seems gets out of bed before the back of July and this is when he does most of his work. But is the the most profitable then?
This, then, was the reason for the Trainer Calendar. What it does is to look at today's date for the past five years and for each of those dates we look at one week either side and then see how the trainer has done.
Because in our example data we're looking at racing on the 15th of December, 2011. So, we're going to look at the window of the 8th of December to the 22nd for each of the years 2006 to 2010 and see how our trainers have fared.
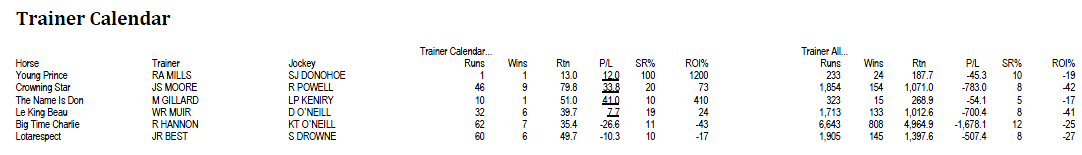
Fig 10. The Trainer Calendar
There's two sections here; the first left hand block of numbers is the Trainer Calendar and the second block is the same trainers but looking at all of their runs over the past five years. Yes, that's a little like the two week run analysis, but goes back for the full five years.
Let's look at the Trainer Calendar. For the previous five Decembers (8th to the 22nd) four of the six trainers are profitable. What is interesting is that the trainer of the top rated Young Prince, RA Mills, has ever only had one runner at this time of year in the past five years. Yes, it won and it won at 12/1 but the question has to be asked why so few runners at this time of year and, of course, he has Young Prince out today.
The other trainers have had a fair number of runners out in December and some have been profitable over thsi period and there's two trainers with decent strike rates in JS Moore and WR Muir. Perhaps this may be something for the jigsaw?
Looking over to the right hand block and we see that none of these trainers are profitable over the last five years with all of their runners. This is no surprise as it takes a rare trainer to be in profit over this amount of time.
Is there anything to be taken from this five year analysis? Perhaps not, though two trainers have a decent strike rate over the whole of this sixty month period. But it's this sort of information which could add to the overall picture which we're trying to build up of the race.
Trainer / Jockey / Course
This is quite simple. For each horse we have a trainer and a jockey. But, the question is how do they fare together at this course? And, more to the point how do they do here in this type of racing?
The Trainer/Jockey/Course, or TJC as we refer to it within UK Horse Racing, will tell us.

Fig 11. Trainer and Jockey at Course (and Race Type)
For our data examples in this section, you will recall, we're at Kempton Park. The race type is All Weather racing and it's a stakes (non-handicap) race.
Here we see that O'Neill riding for R Hannon here at this course is a very strong combination. Over the past five years these two here have raced 34 times, won 5 of them and are 24 points in profit. Steve Drowne has been here 64 times for J Best and has only won twice resulting in a 35 point loss. Gillard and Henry have never raced here together at all.
So, this is interesting but what if we push it further and look at non handicap all-weather racing at Kempton Park; how do our trainer and jockey pairs fare then?
Well, the O'Neill and Hannon pairing has really fallen off the edge; from having a good profit they make a loss. It may be fair to suggest that together here at Kempton it may be better to wait for a handicap race before backing these two. Already another peice of the jigsaw has fallen into place and we may have decided that this horse may not be worth the backing.
This part of the ratings, we feel, are overlooked by those looking at them and they really oughtn't be. Of course there may not be positives or negatives raised from it for every race but it doesn't do any harm to look this over, even briefly.
Trainer / Course
Trainer at Course, or TC as we call it, is basically how well, over the past five years, has this trainer done at this course.

Fig 12. Trainer at Course
Well this goes some way to explain why Gillard and Kenry haven't raced together here before; this will be the first time tha the trainer, Gillard, has had a runner here at Kempton Park.
What is interesting is that none of the trainers have done well here though the least worst, it could be argued, is WR Muir with a ten percent strike rate and with the least worst ROI. Theres no great postives from these figures but Muir's form here isn't the worst.
Trainer / Jockey
One which, again, we have abbreviated to TJ. This is, as expected, is a look at how the trainer and jockey have fared together over the last five years at any course.

Fig 13. Trainer and Jockey
This is interesting; four of the six pairs here are profitable and the Hannon/O'Neill partnership springs out and can be added to the picture. Now trying to join the dots we see that these two are good together and certainly good at Kempton Park (see the Trainer / Jockey / Course part above) but Hannon here is no good, so it seems that the magical addition of O'Neill as a rider is the vital key here.
This is an example of how a picture can start to emerge by just looking at these tables.
Jockey / Course
Quite obviously, how each jockey has done at this course over the past five years and abbreviated to JC.

Fig 14. Jockey at Course
Well, some awful figures here. It can be argued that S Drowne just doesn't like racing at Kempton at all. In fact there's nothing inspiring here at all when it comes to this combination.
Again, now and then something really significant stands out with these figures and it's time to take note. As for our jigsaw puzzle if we look at the riders who have ridden here over one hundred times then we see that all made a loss if we backed them all for £1. So, perhaps there's nothing to add to the picture in this example.
Since this section was written the Detailed Ratings reports have been updated so that all profitable Trainer, Jockeys, etc. are underlined as they are in the Recent Trainer Form to make reading easier.
Weight & Class Differentials
Let's jump, for the moment, over the the large section which deals with each horses' form and look at the next set of tables, the Differentials.
More information on this can be read here in the Differentials page.

Fig 15. Class Differentials
Race Class is, as you may be aware, is something which we look at differently from most people. The BHA declare that they are going hold a race and it's going to be a certain class of race and that the conditions of entry are this and that and, in return, the prize money structure will be so and so.
Now, this is no fault of the BHA because they are going to have to work with events in the future and they can only plan for certain quality of racing. If they don't get the horses which they want turning up but a collection of poorer animals then this is no fault of theirs and even though they may have declared that the race in question is a Class 1 race it may be a very poor race indeed.
Thankfully, we don't have to fall into the same trap. We can, and do, look at the list of horses going to line up in the race and then calculate what we think that the race class is going to be. Which is why one will see that, for example this Handicap Hurdle above is Class 91.
When we've done this we can go further and start to compare how each horse has done in each race of the same type. In the Form section we can see the Race Class figures of the races each horse as been in but this Class Differential just simply distills the form data into one easy to view list.
This race in the above picture is a Hurdle race. So, for each horse we go through its back history and look at all the Hurdles, the same race type. We then calculate the average race class and then compare it with today's.
The first horse in the list, Luggers Hall, has run in a average class of 103.1 and today's race class is 11.7 pounds lower than his average. As ever we try to make the numbers so that Big Is Better. The next pair of columns show us the average class race in which the horse has won (again, in the same race type) and clearly Luggers Hall has never won a hurdle before.
The next horse is interesting, King Zeal, also has a positive Class Differential of 10.5 (today's race class is actually 91.4, as you may have worked out for yourself) and he has run at least one hurdles race where the average class was 96.3. In other words he's won stronger races than today.
When I see horses in the top three with a good positive Class Differential like the three top rated here I take note. I also take note if they have won before and what the average winning race class is.
But it's not only about Class. Weight has a part to play too. A horse can be dropping in class but is compelled to carry more lead in its saddlecloth, so we need to see how horses fare at different weights.

Fig 16. Weight Differentials
Again, remember that Big Is Better, so a large positive number will mean a large weight drop and a large negative number will mean a large rise in weights.
The first thing to see is that no horse today is running with less weight than its previous winning average (again hurdles). Boston Blue is carrying 18 pounds more than it's previous winning average weight, for example, and whilst King Zeal looked interesting in the previous Class Differential it doesn't look so attractive now.

Fig 17. Class & Weight Differentials
And, of course, we can combine the two together to see how the Class and Weight combined Differential is for the race.
Looking at this table any advantages gained in Class were lost to Weight and vice-versa. Of course Pickles looks interesting and even though he hasn't won over hurdles before it would be wise to have a look at the form of this horse to see if he can take advantage of this opportunity.
Edit: Prickes was placed at 33/1.
Better Class Winners
Similar to above there is a section in the ratings which show us which horses have won better Class races and also have won a higher Class+Weight race in the past.

Fig 18. Better Class and Better Class+Weight Winners
This section is always worth looking at. In this example, Trip The Light had won a better Class race and also a race with more Class+Weight. Was a total surprise that Trip The Light won this race?
Courses and Distances
The next few sections list all the horses which have run at the same course and distance last time, the same course and different distance and, finally, same distance but at another course. This is a simply checklist so that one can see if a horse's last run may give a clue to today's race.